

Best JavaScript Debugging Tools and Techniques for Developers in 2025
Table of Contents
In 2025, debugging JavaScript isn’t just about looking at the console. Modern applications are complex, asynchronous, and performance-sensitive. Fortunately, today’s developers have access to a powerful arsenal of debugging tools and techniques that make bug hunting faster and smarter.
This guide covers the best JavaScript debugging tools and browser-based techniques for developers in 2025, helping you troubleshoot errors, improve code reliability, and ship cleaner apps.
🧰 Best JavaScript Debugging Tools (2025 Edition)
These tools help identify runtime errors, breakpoints, memory leaks, and more:
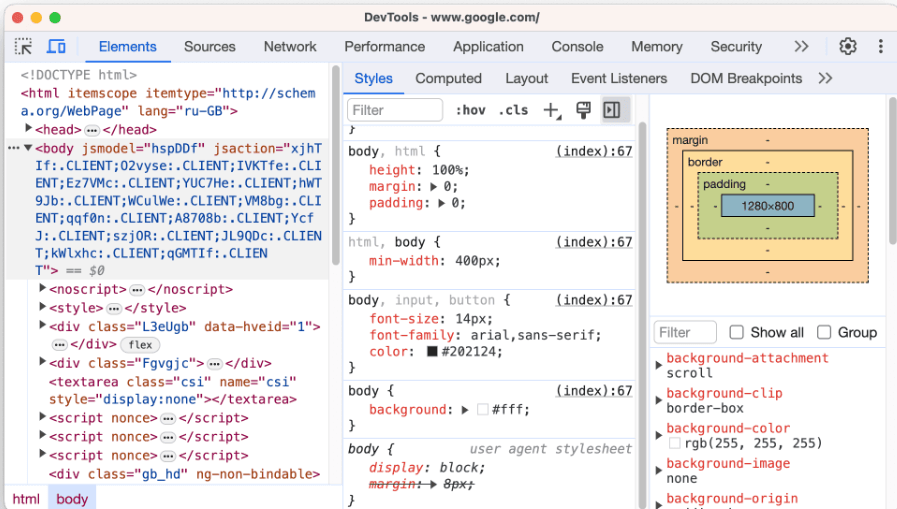
1. Chrome DevTools
One of the most powerful debugging environments built into the browser. It offers features like breakpoints, live editing of HTML/CSS/JS, network inspection, and performance profiling. The “Sources” tab allows developers to pause execution, step through code line-by-line, and watch the value of variables in real time.
- Best for: In-browser debugging and performance monitoring
- Pro Tip: Use async call stacks and conditional breakpoints to dig into tricky bugs
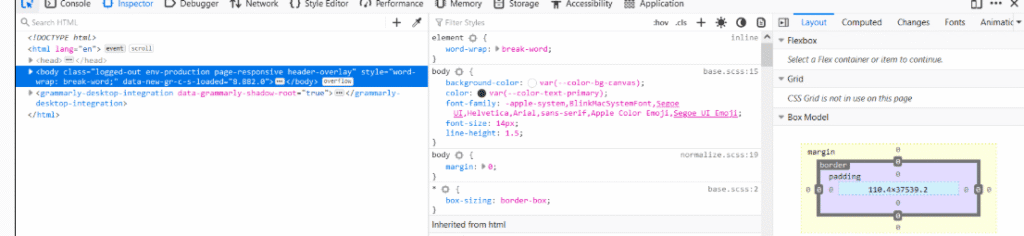
2. Firefox Developer Tools
An alternative to Chrome, Firefox’s DevTools provide a visually rich debugging interface. The “Inspector” and “Debugger” tabs are robust, and the layout tools are especially handy for CSS issues.
- Best for: Visual debugging and layout fixes
- Unique Edge: Built-in accessibility tools
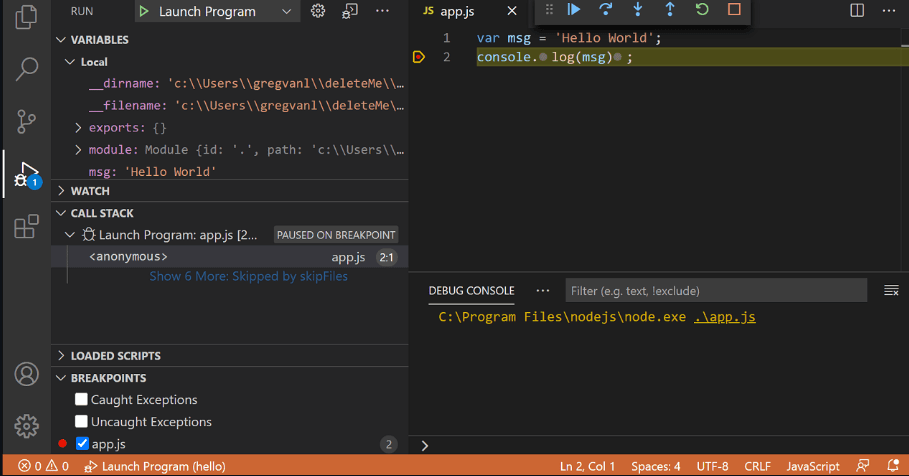
3. VS Code JavaScript Debugger
VS Code’s built-in debugger connects directly to browsers and Node.js environments, allowing you to write, debug, and run code from one place. You can set breakpoints in the editor and instantly sync them with Chrome or Edge.
- Best for: Integrated local debugging
- Pro Tip: Use launch.json for seamless configuration across environments
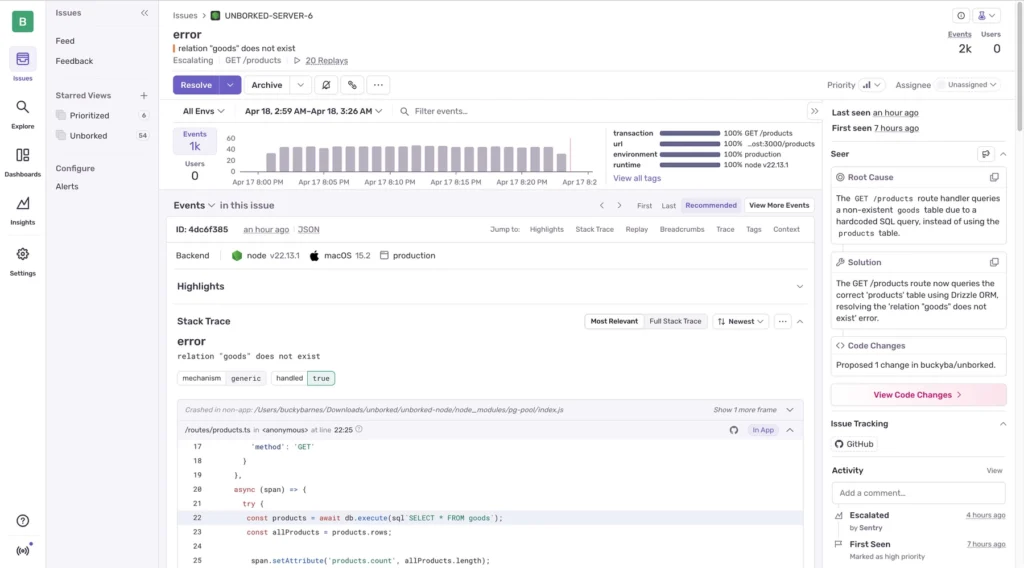
4. Sentry
Sentry tracks runtime errors in live production environments. It captures stack traces, user actions, device/browser context, and environment variables. Integrates with React, Vue, Angular, and Node.js.
- Best for: Post-deployment error tracking
- Pro Tip: Set alerts and filters for specific environments (e.g., staging vs. production)
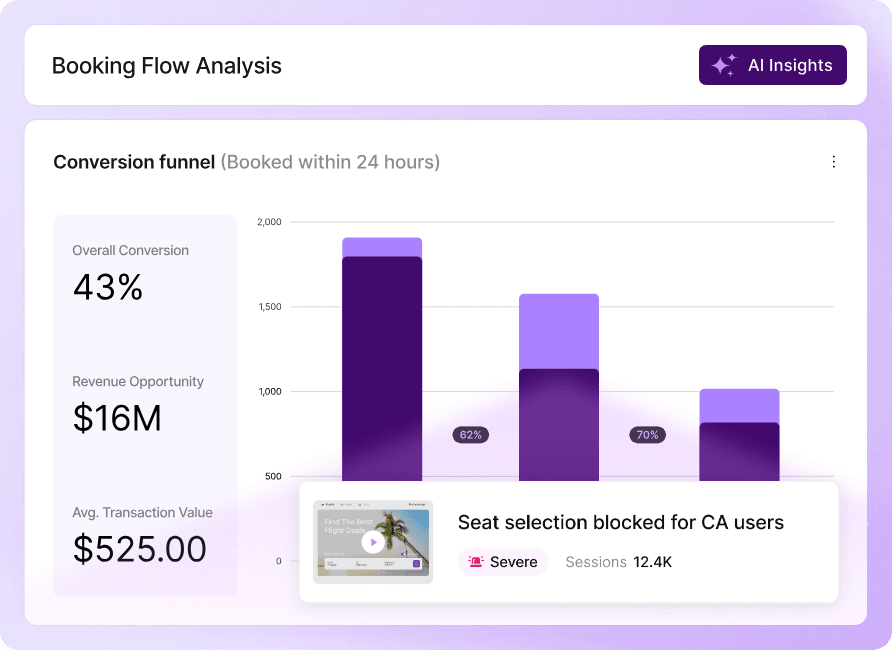
5. LogRocket
Combines session replay with logs, performance data, and network tracing. You can watch exactly what the user did before an error occurred. Great for resolving user-reported bugs.
- Best for: Reproducing hard-to-catch bugs
- Pro Tip: Integrate with Sentry to get full context + stack trace + session replay
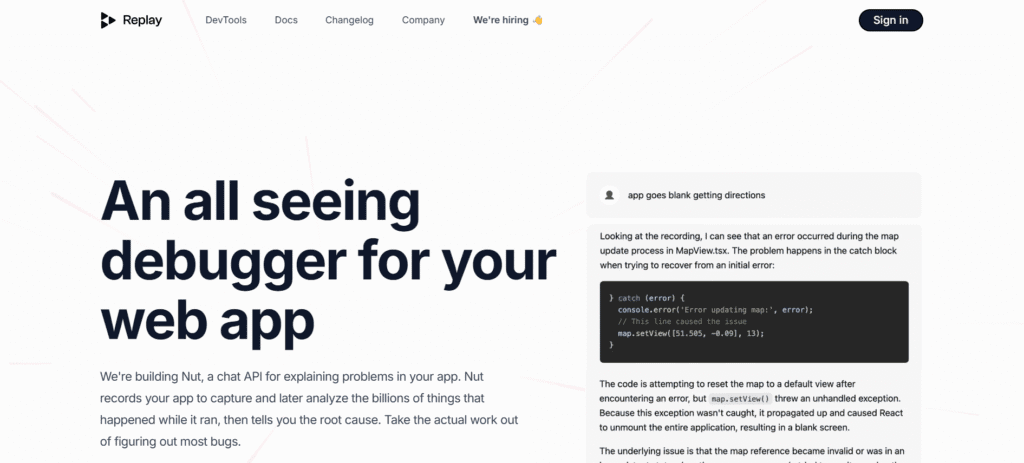
6. Replay.io
A modern time-travel debugger for web apps. It records your app like a video, but lets you inspect everything — logs, DOM state, network, and code at any point in time.
- Best for: Retroactive debugging
- Pro Tip: Use for debugging flakey tests and intermittent UI bugs
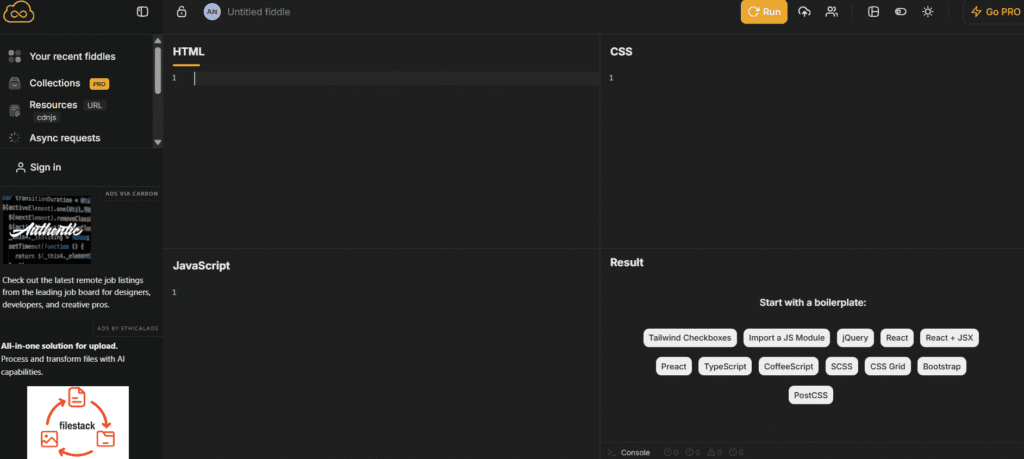
7. JSFiddle / CodeSandbox
Great for isolating bugs in small snippets. These tools provide quick setup for debugging JavaScript without a full local environment.
Useful Links
- The End of Localhost? Why Cloud Dev Environments (CDEs) Are Taking Over
- Cybersecurity for AI Workloads: Protecting ML Pipelines in 2025 and Beyond
- AI-Native Grads vs. Traditional Developers: The Talent War CEOs Are Betting On
- Google’s New Ranking Factor Is Quietly Killing Small Developer Blogs (2025 Guide)
- 📛 What Developers Should Stop Doing in 2025 (And What to Do Instead)
- Analytics Tools for Developers That Go Beyond Google (2025 Guide)
🧠 Modern JavaScript Debugging Techniques
Alongside tools, these techniques help resolve bugs faster:
- Use Source Maps to trace minified or transpiled code (e.g., from Webpack or Babel)
- Set Conditional Breakpoints in DevTools to only pause under specific conditions
- Use Watch Expressions to track variable values during execution
- Trace Async Stack Frames to debug
setTimeout(),fetch(), andPromisechains - Use the Performance Tab in DevTools to profile bottlenecks and rendering delays
- Log smarter with console.table() and structured logs🔄 Fixing Common Debugging Issues in JS
- If you’re stuck on a bug and none of your breakpoints hit, you’re not alone. Here’s how to handle common issues:
- Debugger not working?
- Check that source maps are enabled in your build tool
- Ensure DevTools isn’t paused on uncaught exceptions
- Restart your browser session or hard reload
- App works locally but breaks in prod
✅ Pro Tips for Faster Debugging
- Use Incognito mode to eliminate cache and extension conflicts
- Enable Pause on Caught Exceptions in DevTools for deeper issues
- Bookmark error reproduction snippets in online playgrounds like JSBin or JSFiddle
- Create a reusable debugging checklist for your team
FAQs
Q1: What are JavaScript debugging tools?
They’re browser-based or IDE-integrated utilities that let developers inspect, step through, and fix issues in their JavaScript code.
Q2: Can you debug JavaScript online?
Yes! Tools like JSFiddle and CodeSandbox allow in-browser JS debugging without setup.
Q3: What’s the most powerful JS debugger in 2025?
For local development: Chrome DevTools. For production: Sentry + Replay.io combo.
Final Thoughts
Debugging is where good developers become great. In 2025, you don’t need to go it alone — you’ve got tools that record errors, visualize state, and even let you “rewind” time.
Start using just one or two of these tools in your workflow, and you’ll debug faster, ship faster, and spend less time shouting at the console.
Useful Links

🚀 Let's Build Something Amazing Together
Hi, I'm Abdul Rehman Khan, founder of Dev Tech Insights & Dark Tech Insights. I specialize in turning ideas into fast, scalable, and modern web solutions. From startups to enterprises, I've helped teams launch products that grow.
- ⚡ Frontend Development (HTML, CSS, JavaScript)
- 📱 MVP Development (from idea to launch)
- 📱 Mobile & Web Apps (React, Next.js, Node.js)
- 📊 Streamlit Dashboards & AI Tools
- 🔍 SEO & Web Performance Optimization
- 🛠️ Custom WordPress & Plugin Development