
Frontend Observability: Tools for Debugging Real User Experiences (2025)
Table of Contents
With the increasing growth of dynamic and user-centric web applications, frontend observability has become one of the key focus areas of developers, product managers, or even DevOps teams. By 2025, when debugging real user experiences (RUEs) it is not enough to look at console errors in your application & debug in real-time, across a diverse array of devices and network conditions.
In this blog, we will discuss the best frontend observability tools in 2025 and how they will help developers to effectively debug issues, optimize performance and digital experience.
My Hosting Choice
Need Fast Hosting? I Use Hostinger Business
This site runs on the Business Hosting Plan. It handles high traffic, includes NVMe storage, and makes my pages load instantly.
Get Up to 75% Off Hostinger →⚡ 30-Day Money-Back Guarantee
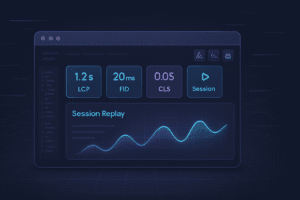
🌐 What is Frontend Observability?
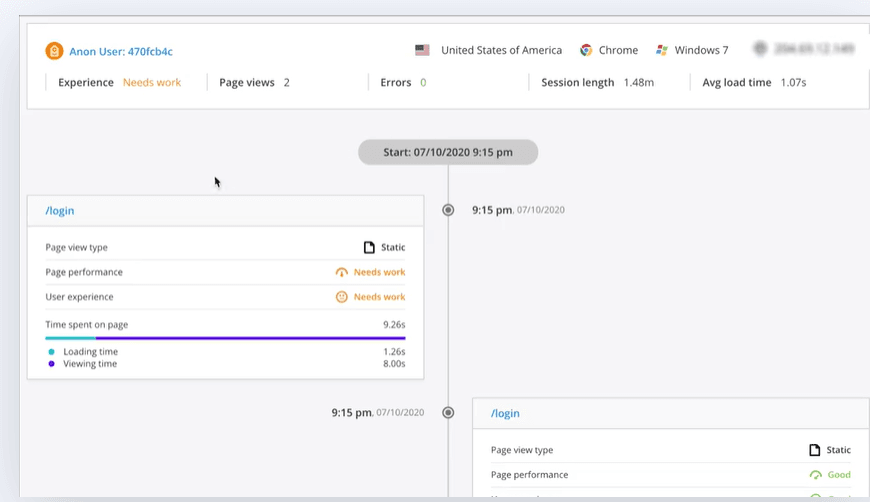
Frontend observability refers to the practice of collecting, analyzing, and visualizing data from the client side of your application. This includes:
- Performance metrics (like First Contentful Paint)
- User interactions
- JavaScript errors
- Resource load times
- Session replays
- Accessibility issues
It allows developers to go from “something broke” to “here’s exactly what happened to the user” in seconds.

🔧 Top Frontend Observability Tools in 2025
1. Sentry
- Best for: Error tracking and performance monitoring
- Sentry now integrates AI-powered issue resolution and auto-tagging of similar errors.
- Features: Session replays, source maps, performance bottleneck highlights
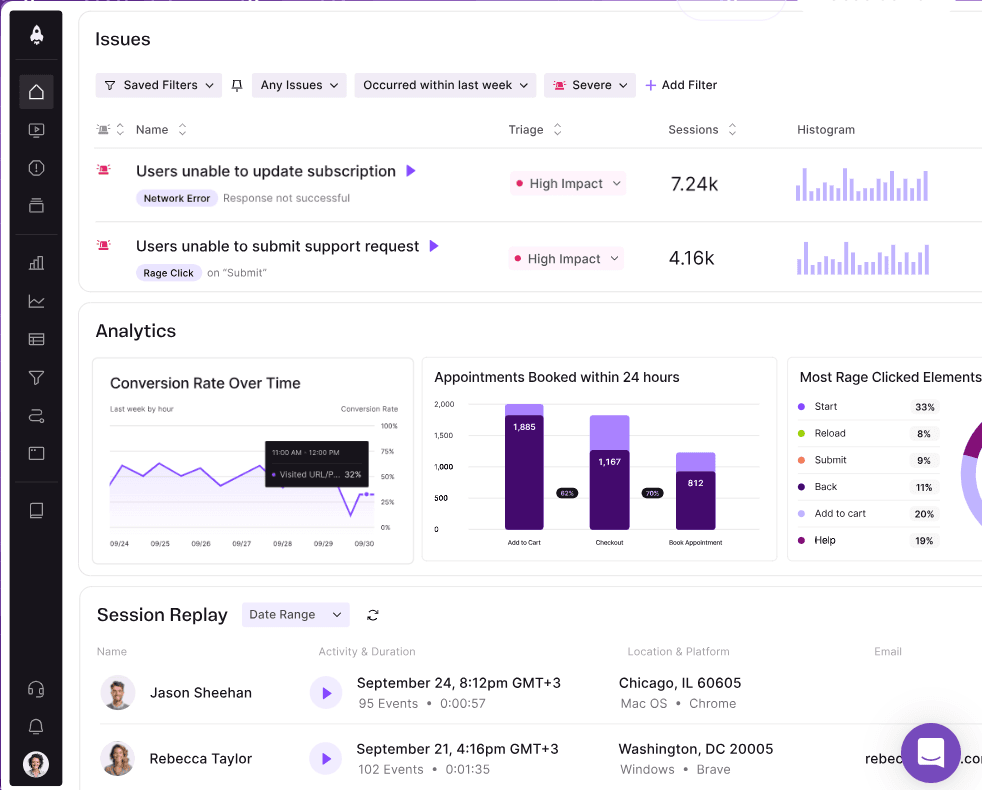
2. LogRocket
- Best for: Session replay and frontend analytics
- Offers pixel-perfect session replays, heatmaps, and network trace logs.
- Great for debugging UI bugs and tracking user frustration signals.
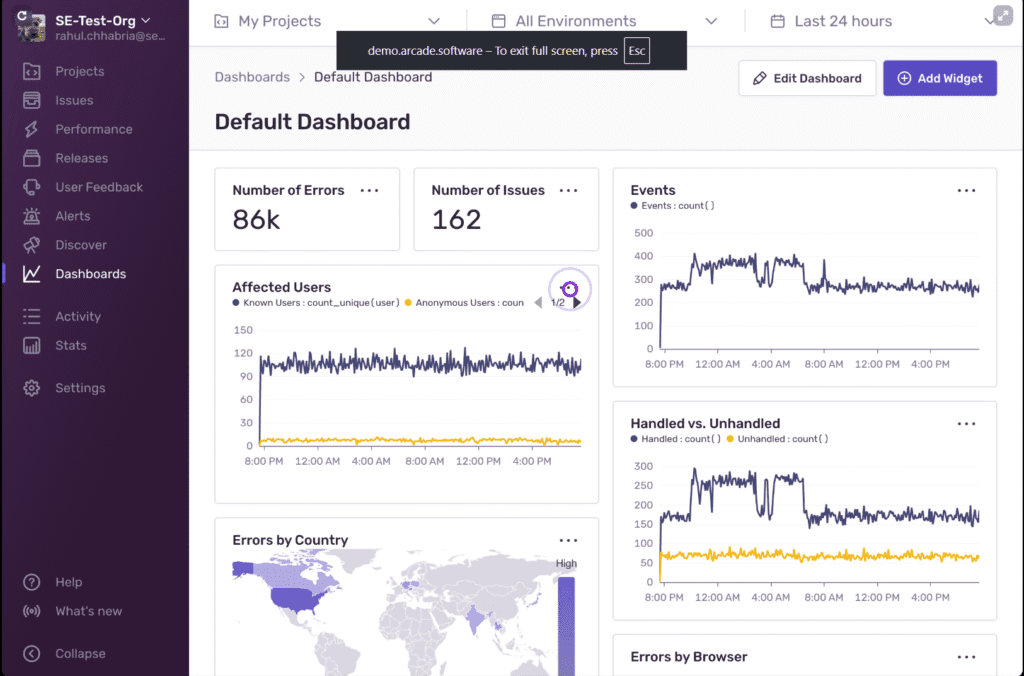
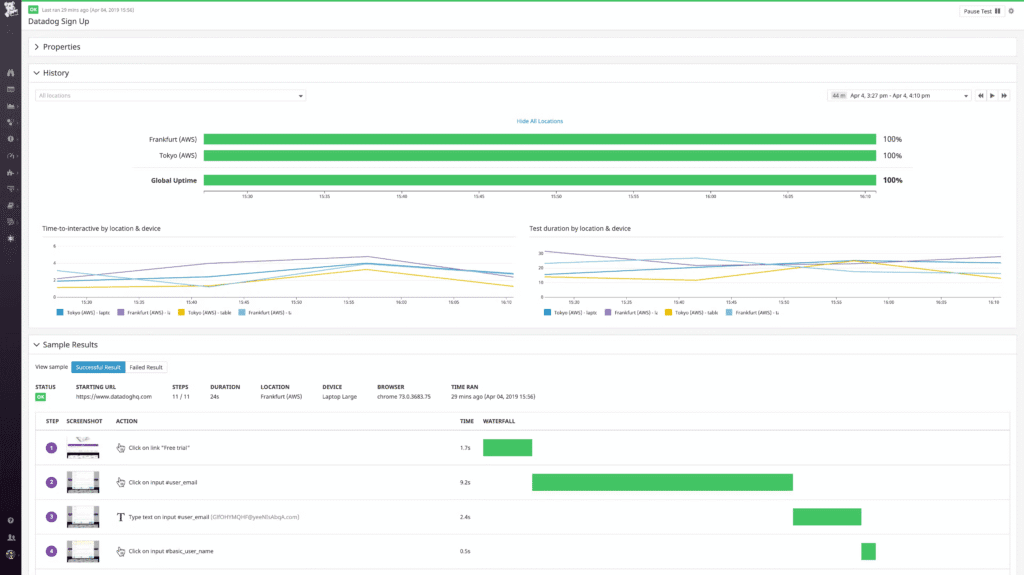
3. Datadog RUM
- Best for: Full-stack visibility
- Combines Real User Monitoring (RUM) with backend traces.
- Easily tie frontend issues to backend services in distributed systems.
👉 https://www.datadoghq.com/product/real-user-monitoring
4. Raygun
- Best for: Performance insights and crash reporting
- Real User Monitoring + APM for web and mobile apps.
- Identifies performance dips and root causes in frontend code.
5. Replay.io (New in 2025)
- Best for: Time-travel debugging
- Open-source tool that records everything: DOM, JS, network, and more.
- Lets you “rewind” app behavior frame-by-frame.
Useful Links
- The Era of Small Language Models (SLMs): Why 2026 Belongs to Edge AI
- Microsoft AutoGen vs. CrewAI: I Ran a “Code Battle” to See Who Wins in 2026
- How to Build AI Agents with LangChain and CrewAI (The Complete 2026 Guide)
- Beyond the Chatbot: Why 2026 is the Year of Agentic AI
- Why Developers Are Moving from ChatGPT to Local LLMs (2025)
- LangChain vs. LlamaIndex (2026): Which AI Framework Should You Choose?
🧠 Why Frontend Observability Matters in 2025
- Users expect flawless digital experiences.
- Frontend code is more complex than ever (React, Vue, SPAs).
- Performance directly affects SEO and conversions.
- Debugging in production is now a business priority.
By investing in proper observability, you empower your teams to resolve issues faster, reduce downtime, and improve user satisfaction.
🙋♂️ Frequently Asked Questions (FAQs)
Q1: What’s the difference between RUM and synthetic monitoring?
RUM (Real User Monitoring) tracks real users on your site, while synthetic monitoring uses bots to simulate user interactions at set intervals.
Q2: How does frontend observability improve UX?
By identifying real bottlenecks, errors, or failed interactions, teams can fix issues before users churn, leading to smoother and faster digital experiences.
Q3: Is frontend observability only for large-scale applications?
Not at all. Even small startups benefit by quickly spotting bugs and understanding how users behave, which helps them iterate faster.
Q4: Can these tools work with modern frameworks like React, Vue, or Angular?
Yes, all tools mentioned support popular JavaScript frameworks and offer plugins or SDKs for easy integration.
Q5: What metrics should I monitor for frontend observability?
Key metrics include:
First Contentful Paint (FCP)
Time to Interactive (TTI)
JavaScript errors
User click paths
API request timing
🔗 Useful Links
- Frontend Performance Checklist 2025 (by Google)
- MDN Web Docs: Performance APIs
- OpenTelemetry JS – Frontend Instrumentation
- Sentry JavaScript SDK Docs
- Replay.io Debugging Guide
🚀 Conclusion
Frontend observability is no longer a “nice-to-have” — it’s a necessity. In 2025, as digital experiences grow richer and more complex, developers must embrace tools that shine light into the frontend black box. Whether you’re fixing a broken button, investigating poor load times, or analyzing user behavior, the right observability tools will help you deliver exceptional, fast, and reliable applications.

🚀 Let's Build Something Amazing Together
Hi, I'm Abdul Rehman Khan, founder of Dev Tech Insights & Dark Tech Insights. I specialize in turning ideas into fast, scalable, and modern web solutions. From startups to enterprises, I've helped teams launch products that grow.
- ⚡ Frontend Development (HTML, CSS, JavaScript)
- 📱 MVP Development (from idea to launch)
- 📱 Mobile & Web Apps (React, Next.js, Node.js)
- 📊 Streamlit Dashboards & AI Tools
- 🔍 SEO & Web Performance Optimization
- 🛠️ Custom WordPress & Plugin Development

Abdul Rehman Khan
Articles: 1643 Comments
Leave a Reply
You must be logged in to post a comment.


[…] Performance focus: Core Web Vitals, frontend observability […]
[…] it’s crucial to act fast. Developers can borrow lessons from frontend engineering, where observability tools for real user monitoring have already proven essential in catching subtle changes before they become […]
[…] why developers are turning to advanced observability stacks, similar to the ones we highlighted in Frontend Observability: Tools for Debugging Real User Experiences. Without robust observability, developers risk losing control over how their apps behave in […]